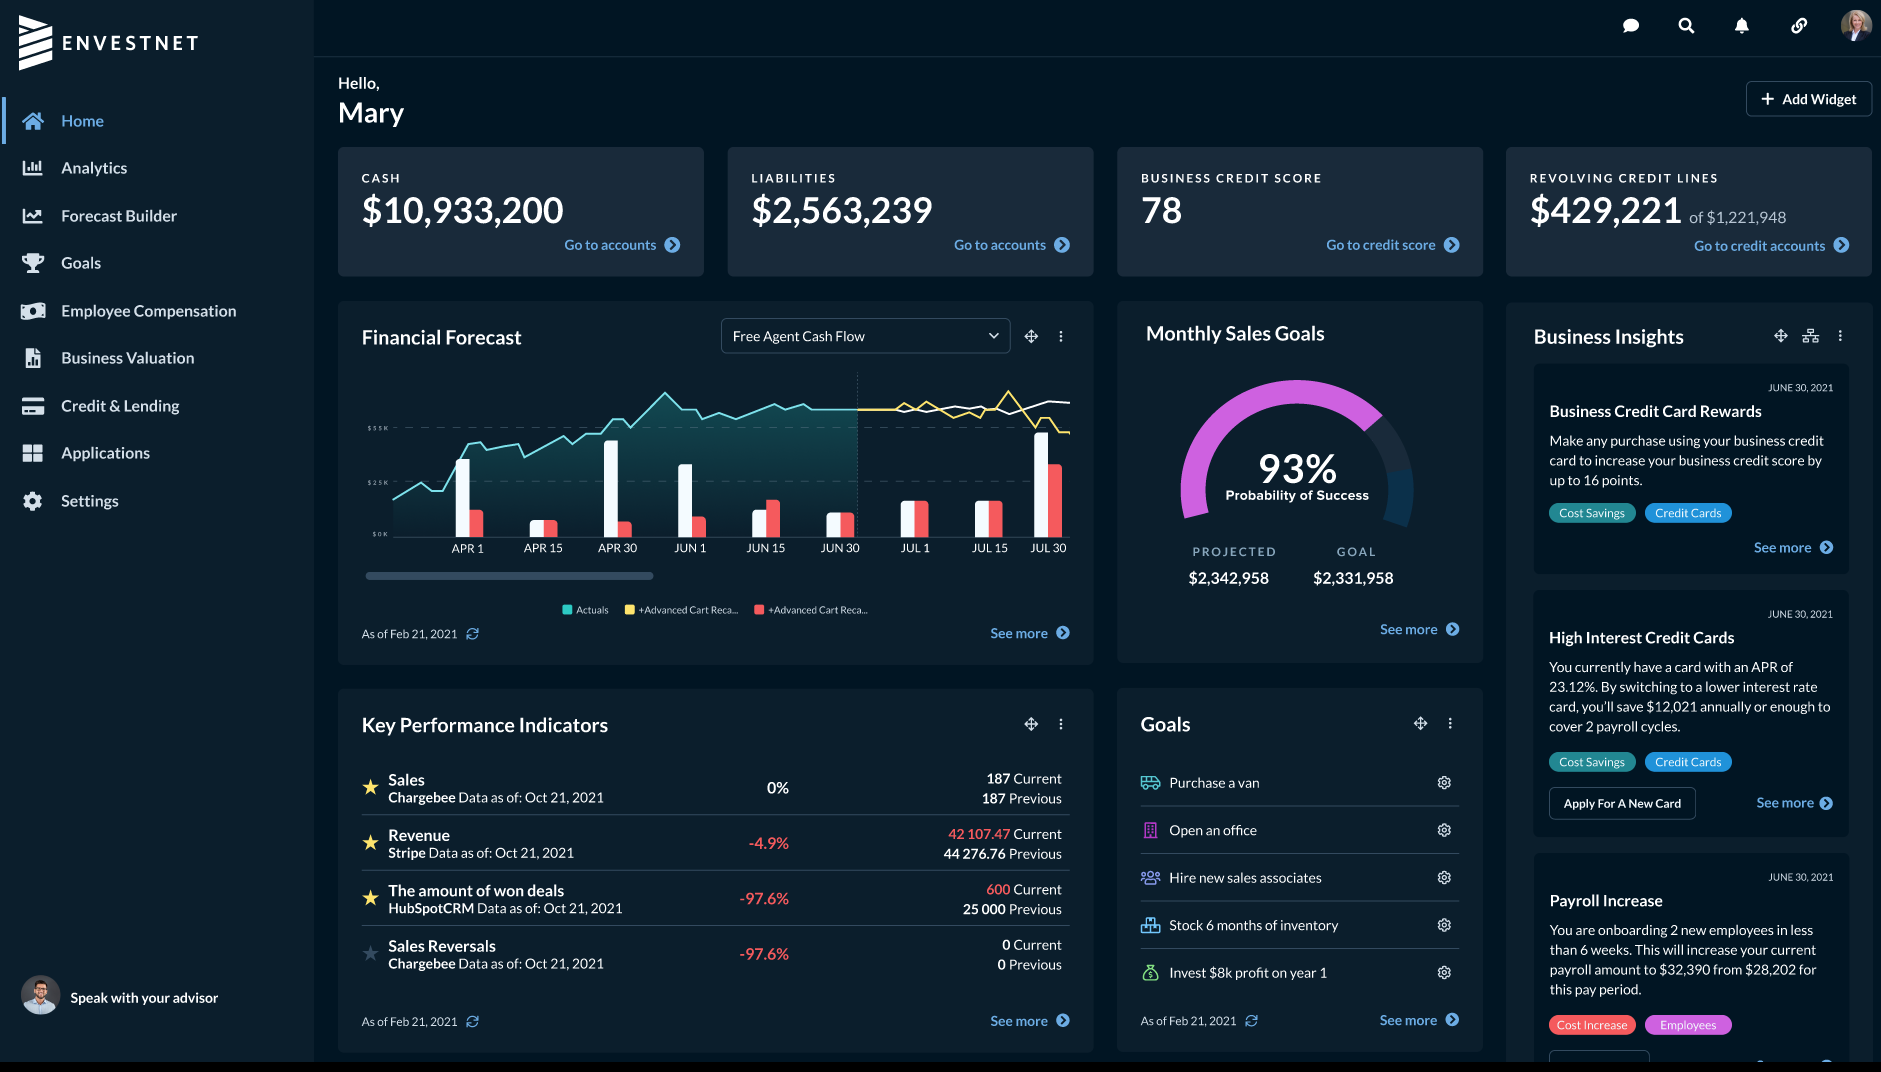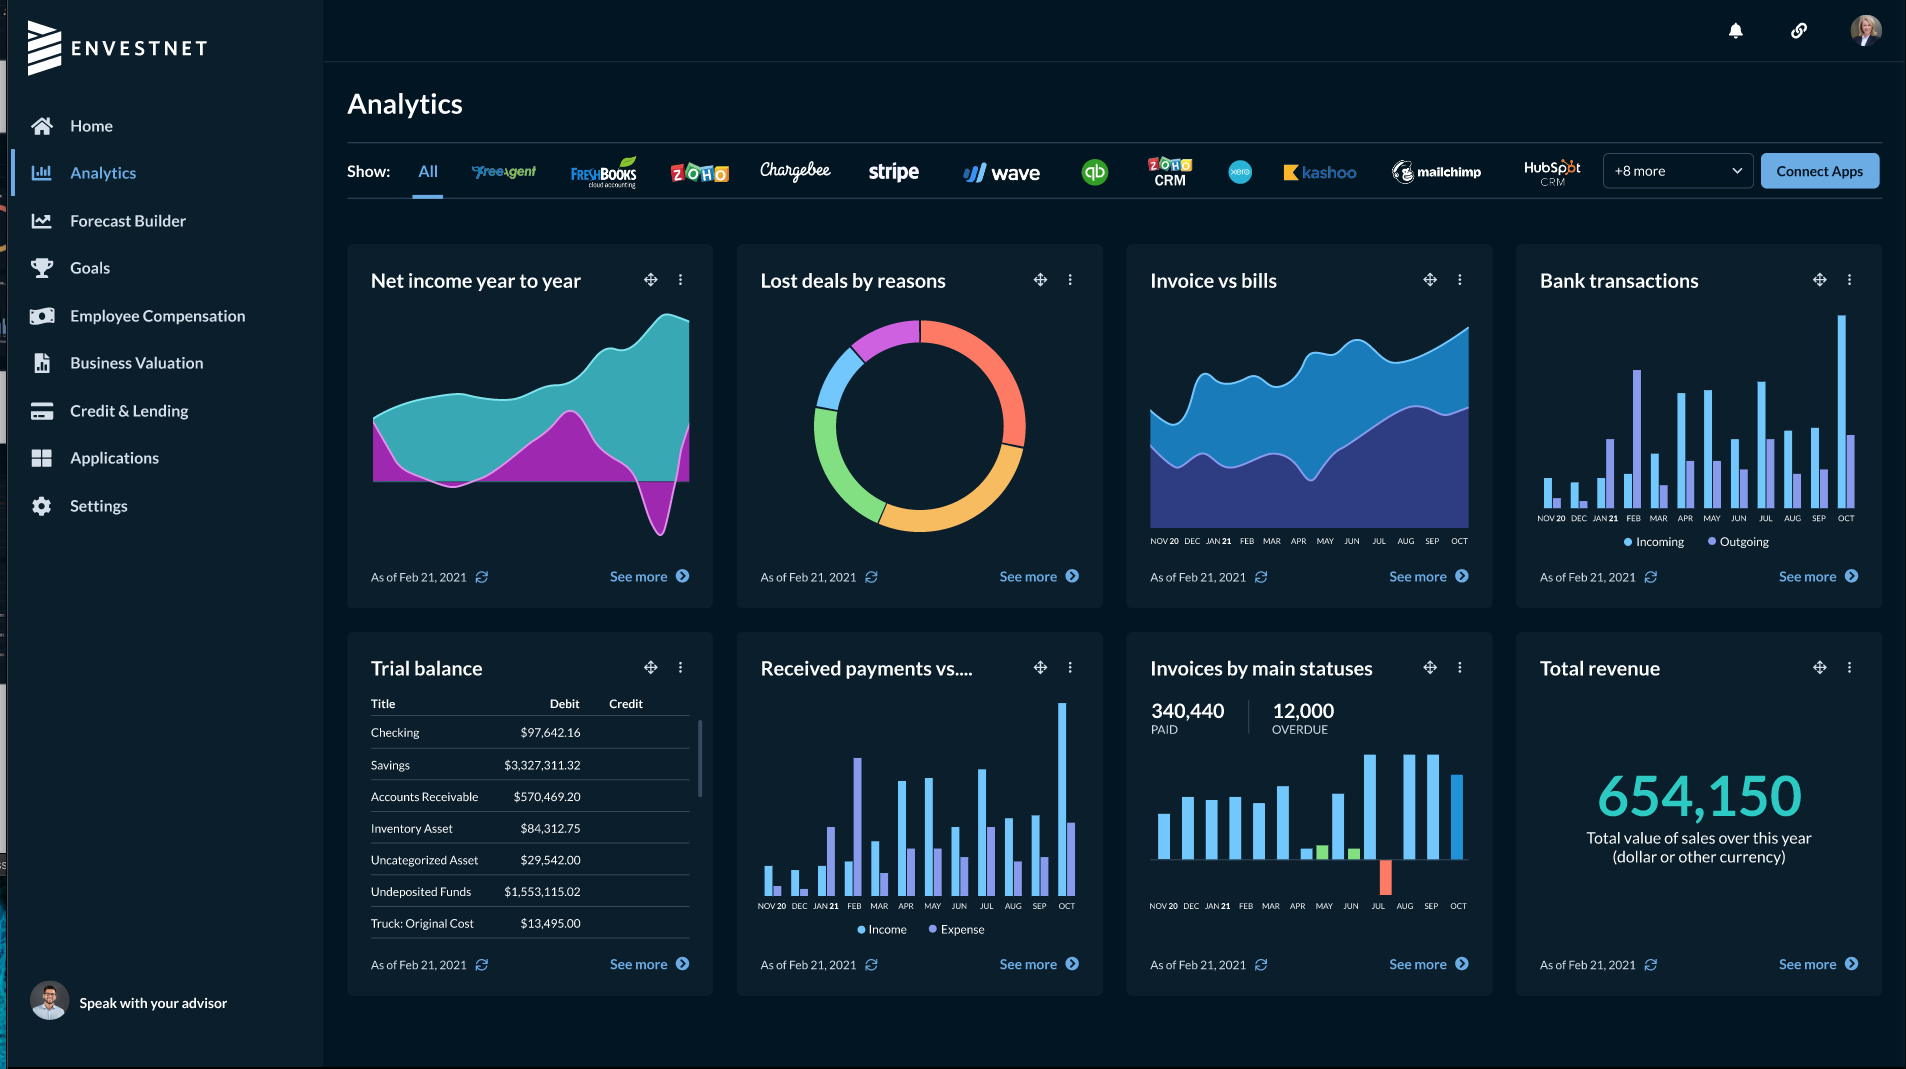
Visualize your data: Our easy-to-use dashboards and data visualization tools make it simple to turn raw data into actionable insights.

Track your KPIs: Keep an eye on your key performance indicators (KPIs) and monitor progress towards your business goals.

Optimize your operations: Identify inefficiencies in your processes and streamline your operations to save time and money and achieve your goals.
View cash flow with accounting data, including assets, liabilities, accounts receivable, and more.
Customizable dashboards gather company-specific data sources and key performance indicators.
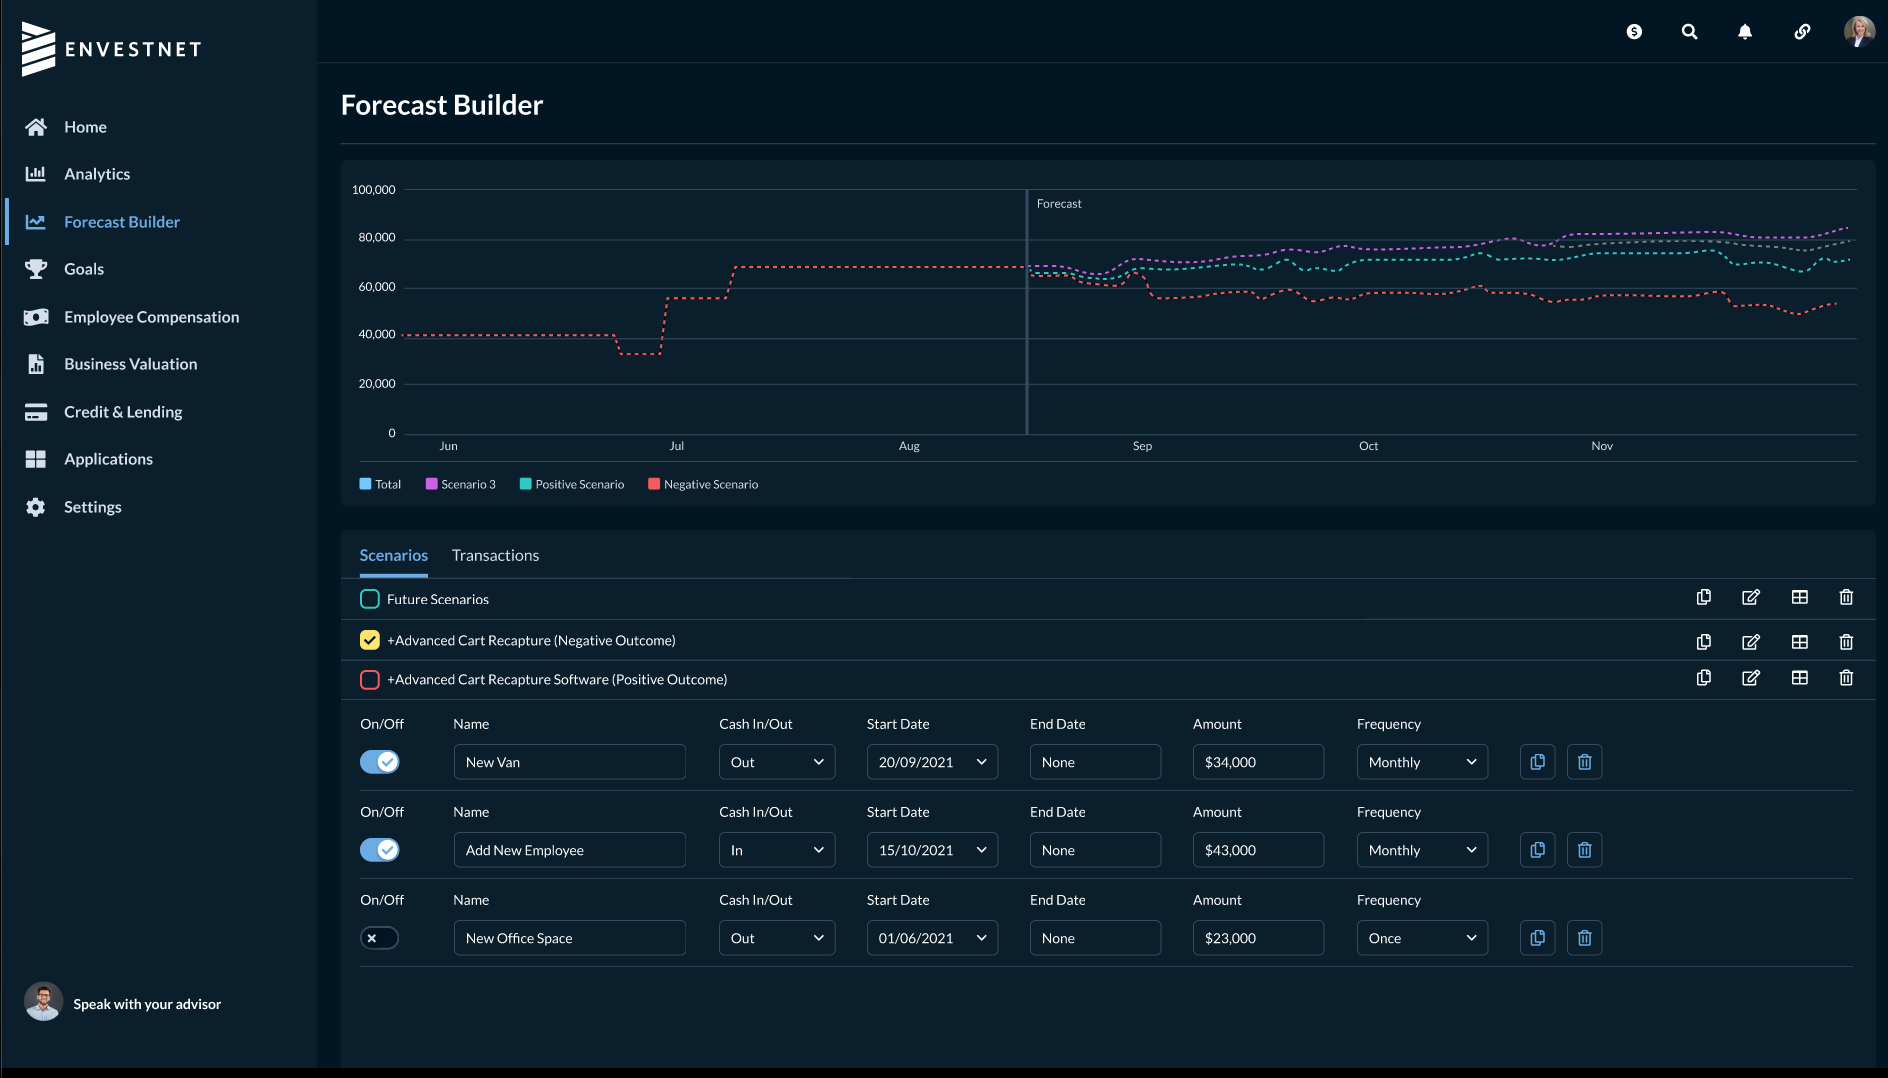
Automatically generate rolling forecasts with powerful scenario-planning tools.
Set company-specific goals (savings, investments, etc) and track performance against them.
14425 Falcon Head Blvd
Building E, Suite 100
Austin, TX 78738
Austin | Philadelphia | Barcelona
833.310.1777